Canara Robeco Bluechip Fund
Date Published: February 12, 2021
SMART INVESTOR GUIDE
FUND FACTS
| Nature | Open Ended | Fund Manager | Sanjay Bembalkar, Shridatta Bhandwaldar |
| Launch Date | 20-Aug-2010 | Benchmark Index | S&P BSE 100 TRI |
| NAV (Rs.) | 32.50 ( 16-Dec-2020 ) | Corpus (Rs.in Crs.) | 1122.46 ( Nov-2020 ) |
| Investment Objective | Investment Objective of the fund is to provide capital appreciation by predominantly investing in companies having a large market capitalization. However, there can be no assurance that the investment objective of the scheme will be realized. |
PORTFOLIO COMPOSITION
The fund has 93.76% of its net assets invested into equity & equity related instruments, balance 6.24% in debt component. The large cap holdings constitute of 86.94% (market cap > Rs.26,595 crs), 6.82% in midcap (market cap > Rs.6937 and < Rs.26,595 crs) and balance 6.24% in debt component. The top 10 holdings of the scheme constitute 52.23% of its net assets. It may be observed that the Quarterly Average AUM of the fund for the end of December 2020 is Rs.133.60 crores.
| Table 1 | |
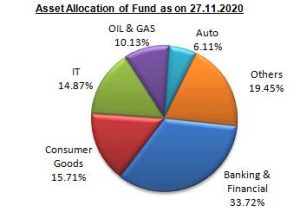
| Sectoral Allocation (in %) as on 27.11.2020 | |
| Top 10 holdings of Fund | Fund Allocation |
| Banking & Financial | 33.72 |
| Consumer Goods | 15.71 |
| IT | 14.87 |
| OIL & GAS | 10.13 |
| Auto | 6.11 |
| Pharma | 5.81 |
| Cement | 2.82 |
| Telecom | 2.51 |
| Housing | 1.56 |
| Table 2 | |||||
| Month End | Equity % | Cash % | Debt % | Scheme Returns % | Index Returns % |
| 27/11/2020 | 93.76 | – | 6.24 | 8.16 | 9.31 |
|---|---|---|---|---|---|
| 31/10/2020 | 95.07 | – | 4.93 | 3.15 | 3.06 |
| 30/09/2020 | 95.28 | – | 4.72 | -2.68 | -3.01 |
| 31/08/2020 | 95.59 | – | 4.41 | 2.74 | 3.01 |
| 31/07/2020 | 94.90 | – | 5.10 | 6.08 | 7.57 |
| 30/06/2020 | 94.49 | – | 5.51 | 6.14 | 7.17 |
| 29/05/2020 | 93.62 | – | 6.38 | -0.17 | 0.55 |
| 30/04/2020 | 95.18 | – | 4.82 | 16.69 | 19.11 |
| 31/03/2020 | 91.67 | – | 8.33 | -19.19 | -22.23 |
| 28/02/2020 | 95.81 | – | 4.19 | -2.69 | -7.34 |
| 31/01/2020 | 96.02 | – | 3.98 | 1.36 | -1.24 |
| 31/12/2019 | 95.16 | – | 4.84 | 1.19 | 0.75 |
| Table 3 | |||
| Top 10 Holdings (% in N.A) | Nov-20 | May-20 | Dec-19 |
| Tata Consultancy Services Ltd. | 4.11 | 2.93 | 3.31 |
|---|---|---|---|
| Reliance Industries Ltd. | 7.07 | 7.53 | 6.57 |
| Kotak Mahindra Bank Ltd. | 2.53 | 4.28 | 4.42 |
| Infosys Ltd. | 7.49 | 5.74 | 5.50 |
| ICICI Bank Ltd. | 7.26 | 5.23 | 7.82 |
| Housing Development Finance Corporation Ltd. | 4.79 | 3.57 | 5.49 |
| HDFC Bank Ltd. | 9.3 | 7.96 | 9.58 |
| HCL Technologies Ltd. | 3.27 | – | – |
| Bajaj Finance Ltd. | 3.68 | 1.76 | 3.93 |
| Axis Bank Ltd. | 2.73 | 1.84 | 3.41 |
PORTFOLIO ANALYSIS
The fund with a beta of 0.81 has a weighted market cap of Rs 3,74,633.23 crores as on November 27, 2020. The PE of the fund is 39.87 as on November 27, 2020. In the latest portfolio, the fund held 43 scrips, out of which 27 scrips were held since one-year period (November-2020 to December-2019).The fund follows a buy-and-hold approach with less churning of its stock portfolio. It holds a blend of growth and value stocks in its portfolio which reflects the strong long-term conviction the fund management has when it picks stocks for the portfolio. It cherry-picks the stocks and sectors that are expected to perform better than the general market. Index heavyweights like HDFC Bank, Reliance Industries, Infosys, and ICICI Bank currently find place in the top 5 portfolio holdings. The one-year return of the fund is 15.28% as against 8.57% of the benchmark index. Among sector holdings, fund’s portfolio has major exposure to Banking and Finance with a combined allocation of about 33%. Additionally, it has other prominent sectors such as, Consumer Goods, Computers IT whereas Pharma, Auto and Telecom in the portfolio with an exposure of approximately 3-5% to 15% in each one. Recently, it added State Bank of India scrip and exited Alkem Laboratories Ltd during its current portfolio (November 2020).
Table1 above tabulates the allocation of top sectors by the fund. The fund has an allocation to 10 sectors, wherein the top 5 sectors constitutes to 80.55%. The fund could outperform its benchmark index in only 06 out of 12 months during the last one year period, maintaining an average equity exposure of 94.71%.
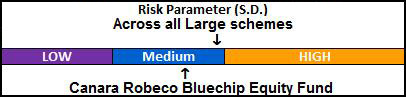
The risk parameter graph measures standard deviation (S.D.) across all the Equity Large Cap schemes. The S.D. of the scheme 10.83%, which is lower than the industry average of the Equity Large Cap schemes of 12.14%. The Sharpe ratio of the scheme is 0.37%, which is higher than the industry average of -0.33%.
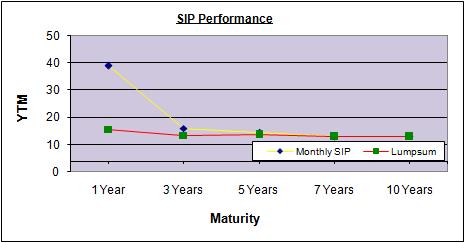
Monthly SIP and Lumpsum vis-à-vis Benchmark: Exhibit 2
| Monthly SIPs Min (Rs.1000 p.m.) | |||||
| SIP Period | Amt Invst. (Rs.) | Canara Robeco Bluechip Equity Fund (Rs.) | S&P BSE 100 TRI(Rs.) | ||
| Market Value | Rets (%) | Market Value | Rets (%) | ||
| 1-Yr. | 12,000 | 14,379 | 38.97% | 14,474 | 40.61% |
| 3-Yr. | 36,000 | 45,651 | 16.08% | 43,024 | 11.94% |
| 5-Yr. | 60,000 | 85,809 | 14.30% | 80,439 | 11.68% |
| 7-Yr. | 84,000 | 1,33,631 | 13.04% | 1,24,670 | 11.10% |
| 10- Yr. | 1,20,000 | 2,37,259 | 13.08% | 2,20,603 | 11.71% |
| Lumpsum (Matching Monthly SIP) | |||||
| SIP Period | Amt Invst. (Rs.) | Canara Robeco Bluechip Equity Fund (Rs.) | S&P BSE 100 TRI(Rs.) | ||
| Market Value | Rets (%) | Market Value | Rets (%) | ||
| 1-Yr. | 12,000 | 13,875 | 15.67% | 13,076 | 8.99% |
|---|---|---|---|---|---|
| 3-Yr. | 36,000 | 46,644 | 13.56% | 42,745 | 8.86% |
| 5-Yr. | 60,000 | 89,620 | 13.71% | 82,927 | 11.00% |
| 7-Yr. | 84,000 | 1,41235 | 13.03% | 1,30,430 | 11.03% |
| 10- Yr. | 1,20,000 | 2,47,431 | 12.84% | 2,27,094 | 11.34% |
Note: (1) Performance is on November 27, 2020. (2) Returns are calculated on the basis of annual compounding.
As it may be observed in Exhibit 2, the fund has outperformed in returns vis-à-vis its benchmark across all time frames. The returns of the fund in both modes (ie. Monthly and Lumpsum) across various time periods witnessed with mixed noticeable variations.
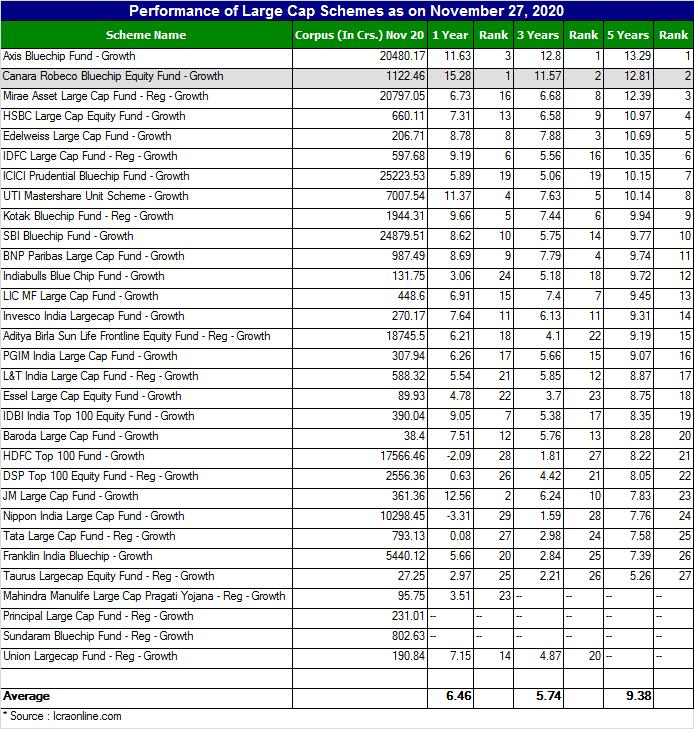
PERFORMANCE
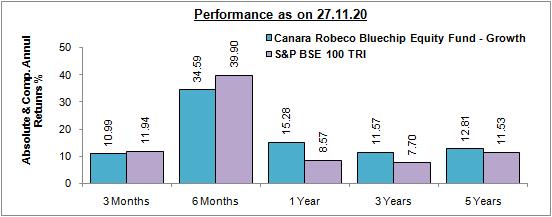
In Exhibit 4, the scheme has outperformed the benchmark index in 1yr, 3 yrs and 5 years horizons. The fund has also outperformed its category average for the period of 1 yr, 3 yrs and 5 yrs respectively. However, the fund’s strategy of sticking to index heavy weights that have been driving the index over the last couple of years has turned in its favour and paid-off investors with superior returns. Over the last 5-year period, the fund has registered a compounded annualised return of around 12.81%, as against 11.53% CAGR delivered by its benchmark S&P BSE 100 – TRI index. Clearly, fund’s recent extra-ordinary performance, supported by its ability to manage downsides, helped it find a space in the list of top category performers. With this the fund has achieved a mark of significantly outpacing the benchmark and prominent category peers across time periods. Categorised under large cap funds, the fund is mandated to invest a minimum 80% of its assets in large-cap stocks. Accordingly, it focuses on bluechip companies and invests in stocks of companies figuring in the list of top 100 companies, based on market capitalisation.
Considering the fund’s performance better than the benchmark, its large cap tilt, the fund may be considered to be a good pick amongst Equity Large Cap Schemes for SIP over next 2 years.
Please Note: The ratings mentioned in the report are declared by Value Research and Crisil has ranked 1 for this fund (For the quarter ended September 30, 2020).
PEER COMPARISON
Start your Investment journey with us
Disclaimer - Mutual Fund investments are subject to market risks, read all scheme related documents carefully.