HDFC Balanced Advtange Fund
Date Published: May 3, 2023

FUND FACTS
|
Nature |
Open ended |
Fund Manager |
Anil Bamboli, Arun Agarwal, Gopal Agrawal, Srinivasan Ramamurthy |
|
Launch Date |
11-Sep-2000 |
Benchmark Index |
NIFTY 50 Hybrid Composite Debt 50:50 Index |
|
NAV (Rs.) |
328.70 ( 30-Nov-2022 ) |
Corpus (Rs.in Crs.) |
51249.87 ( Nov-2022) |
|
Investment Objective |
To provide long term capital appreciation / income from a dynamic mix of equity and debt investments. There is no assurance that the investment objective of the Scheme will be realized. |
||
PORTFOLIO COMPOSITION
The fund has 93.75% of its net assets invested into equity & equity related instruments and balance 6.25% in cash and others. The large cap holdings constitute of 6.49% (market cap > Rs.47,228 crs), 19.42% in midcap (market cap > Rs.16,367 and Rs.16,367 crs), and balance 7.48 % in debt and cash component. The top 10 holdings of the scheme constitute 22.89% of its net assets. It may be observed that the Quarterly Average AUM of the fund for the end of June 2022 is Rs. 2010.49 crs.
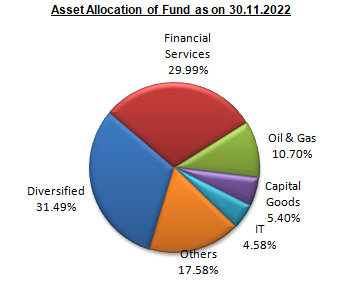
| Sectoral Allocation (in %) as on 30.11.2022 | |
|---|---|
| Top 10 holdings of Fund (Table 1) | Fund Allocation |
| Diversified | 31.49 |
| Financial Services | 29.99 |
| Oil & Gas | 10.70 |
| Capital Goods | 5.40 |
| IT | 4.85 |
| Power | 4.77 |
| Construction | 3.83 |
| Fast Moving Consumer Goods | 3.05 |
| Auto | 1.84 |
| Telecommunication | 1.70 |
| Month End | Equity % | Debt % | Cash % | Scheme % Returns | Category Average% Returns |
|---|---|---|---|---|---|
| 30.11.2022 | 65.89 | 21.11 | 13.00 | 3.68 | 2.32 |
| 31.10.2022 | 65.88 | 19.93 | 14.19 | 4.91 | 2.29 |
| 30.09.2022 | 64.44 | 18.56 | 17.00 | -2.18 | -1.47 |
| 31.08.2022 | 68.40 | 16.96 | 14.64 | 3.88 | 2.44 |
| 29.07.2022 | 67.71 | 17.48 | 14.81 | 6.75 | 5.10 |
| 30.06.2022 | 65.22 | 17.38 | 17.40 | -2.41 | -2.40 |
| 31.05.2022 | 65.33 | 17.65 | 17.02 | -1.22 | -1.67 |
| 29.04.2022 | 62.48 | 18.39 | 19.13 | 1.97 | 0.17 |
| 31.03.2022 | 65.90 | 15.73 | 18.37 | 2.90 | 2.06 |
| 28.02.2022 | 62.21 | 17.03 | 20.76 | -2.26 | -1.26 |
| Top 10 Holdings (% in N.A) | Nov-22 | May-22 | Dec-21 |
|---|---|---|---|
| State Bank Of India | 5.80 | 7.46 | 9.80 |
| HDFC Bank Ltd. | 5.12 | 4.82 | - |
| ICICI Bank Ltd. | 5.00 | 4.54 | 4.73 |
| Coal India Ltd. | 4.37 | 5.49 | 4.36 |
| National Thermal Power Corporation Ltd. | 3.54 | 4.26 | 5.52 |
| Infosys Ltd. | 3.40 | 1.97 | 2.61 |
| ITC Ltd. | 3.09 | 3.48 | 3.48 |
| Housing Development Finance Corporation Ltd. (HDFC Ltd.) | 2.93 | 0.71 | - |
| Reliance Industries Ltd. | 2.77 | 1.79 | 0.44 |
| Larsen & Toubro Ltd. | 2.67 | 2.65 | 3.79 |
PORTFOLIO ANALYSIS
Balanced advantage funds (BAF) or dynamic asset allocation funds (DAAF) are hybrid funds — they invest in a mix of equity and debt instruments. However, unlike other hybrid funds that vary their equity and debt allocation within a SEBI-defined range, BAFs manage this dynamically (no pre-set limits) in line with changing market dynamics. Such funds modify their equity exposure depending on how attractive the stock market looks based on factors such as market valuations and trend (momentum). BAFs pare their equity exposure when markets are at a high and raise it when they are at a low. The fund's top 5 holdings are in State Bank of India, HDFC Bank, ICICI Bank, Coal India Ltd., National Thermal Power Corp. Ltd.
Table 1 above tabulates the allocation of top 10 sectors by the fund. The fund has an allocation to 15 sectors, wherein the top 5 sectors constitutes to 82.42%. The fund could outperform its benchmark index in 08 out of 12 months during the last one year period, maintaining an average equity exposure of 65.57%.
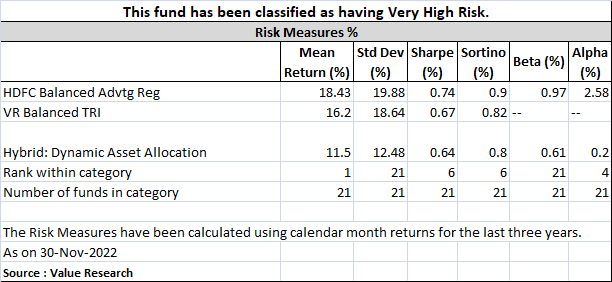
The risk parameter graph measures standard deviation (S.D.) across all the Hybrid : Dynamic Asset Allocation schemes. The S.D. of the scheme is 19.88%, which is higher than the industry average of the Dynamic Asset Allocation schemes of 12.48%. The Sharpe ratio of the scheme is 0.74%, which is higher than the industry average 0.64%.
Monthly SIP and Lumpsum vis-à-vis Benchmark:
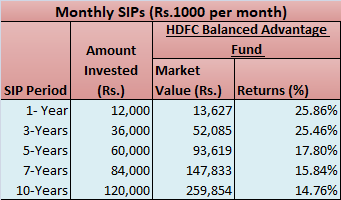
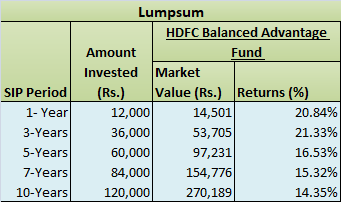
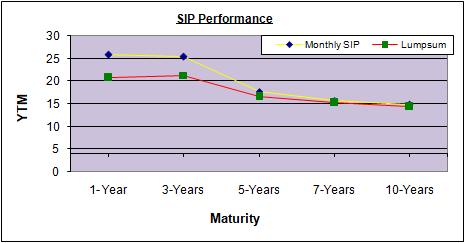
Note:(1) Performance is on November 30, 2022. (2) Returns are calculated on the basis of annual compounding. As it may be observed in Exhibit 2, the fund has outperformed in returns vis-à-vis its benchmark across all time frames. The returns of the fund in both modes (ie. Monthly and Lumpsum) across various time periods witnessed with mixed noticeable variations.
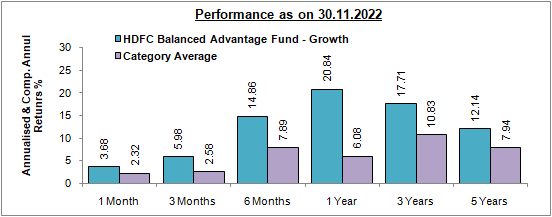
PERFORMANCE:(1) In Exhibit 4, the scheme has outperformed the benchmark index in all time horizons. The fund has also outperformed its category average over all time period respectively. At the current market level from a return perspective, this fund would have generated a higher return compared to peers from the balanced advantage category because of high equity allocation, but it also adds more volatility. HDFC Balanced Advantage Fund’s scheme ability to deliver returns consistently is higher than most funds of its category. Its ability to control losses in a falling market is average. This Fund Holds Rs. 51,249.87 crores of Corpus, the highest AUM in the balanced advantage fund category. Balanced Advantage Funds are good for conservative investors who are looking to generate higher returns than debt with limited risk.
Please Note:The ratings mentioned in the report are declared by Value Research
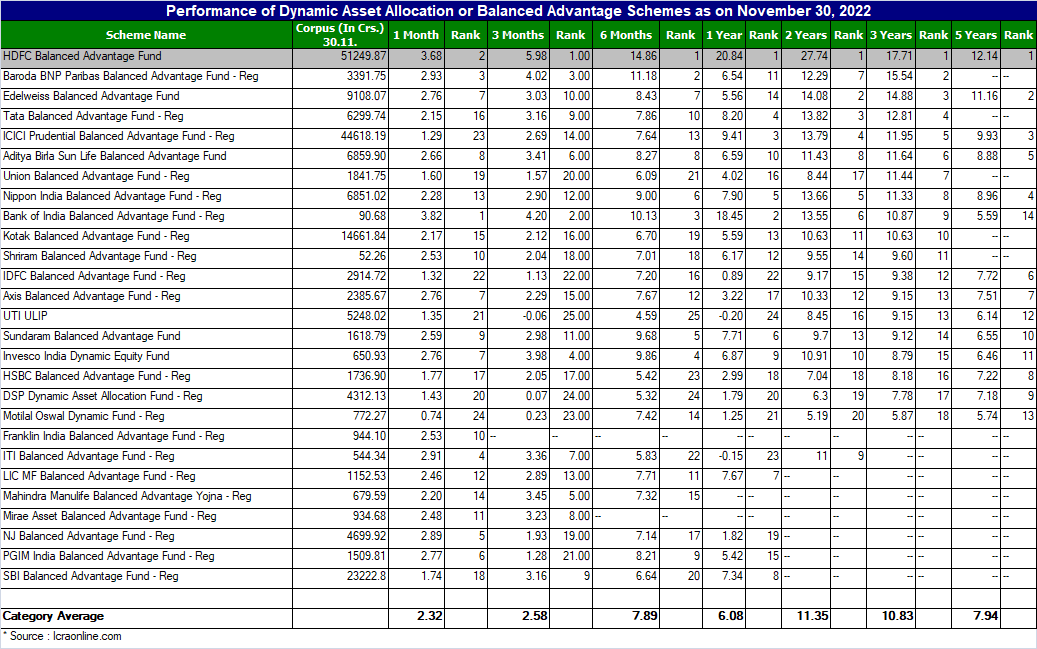
PEER COMPARISON
Start your Investment journey with us
Disclaimer - Mutual Fund investments are subject to market risks, read all scheme related documents carefully.