ICICI Prudential Large & Mid Cap Fund
Date Published: November 20, 2023

FUND FACTS
|
Nature |
Open ended |
Fund Manager |
Ihab Dalwai |
|
Inception/ Allotment Date |
09-Jul-98 |
Benchmark Index |
Nifty LargeMidcap 250 TRI |
|
NAV (Rs.) |
665.54 ( 31-Aug-2023 ) |
Corpus (Rs.in Crs.) |
9364.53 ( Aug-2023 ) |
|
Investment Objective |
To generate long-term capital appreciation from a portfolio that is invested predominantly in equity and equity related securities of large-cap and mid-cap companies. However, there can be no assurance or guarantee that the investment objective of the Scheme would be achieved. |
||
PORTFOLIO COMPOSITION
The fund has 92.41% of its net assets invested into equity & equity related instruments, balance 6.96% in debt component and 0.63% in others. The large cap holdings constitute of 55.00% (market cap > Rs.49,687 crs), 37.42% in midcap (market cap > Rs.17,409 and < Rs. 49,687 crs), 3.91% in small cap (market cap 0 < Rs. 17,409 crs) and balance 3.66% in debt and other component. The top 10 holdings of the scheme constitute 36.63% of its net assets. It may be observed that the Quarterly Average AUM of the fund for the end of June 2023 is Rs.5142.98 crores.
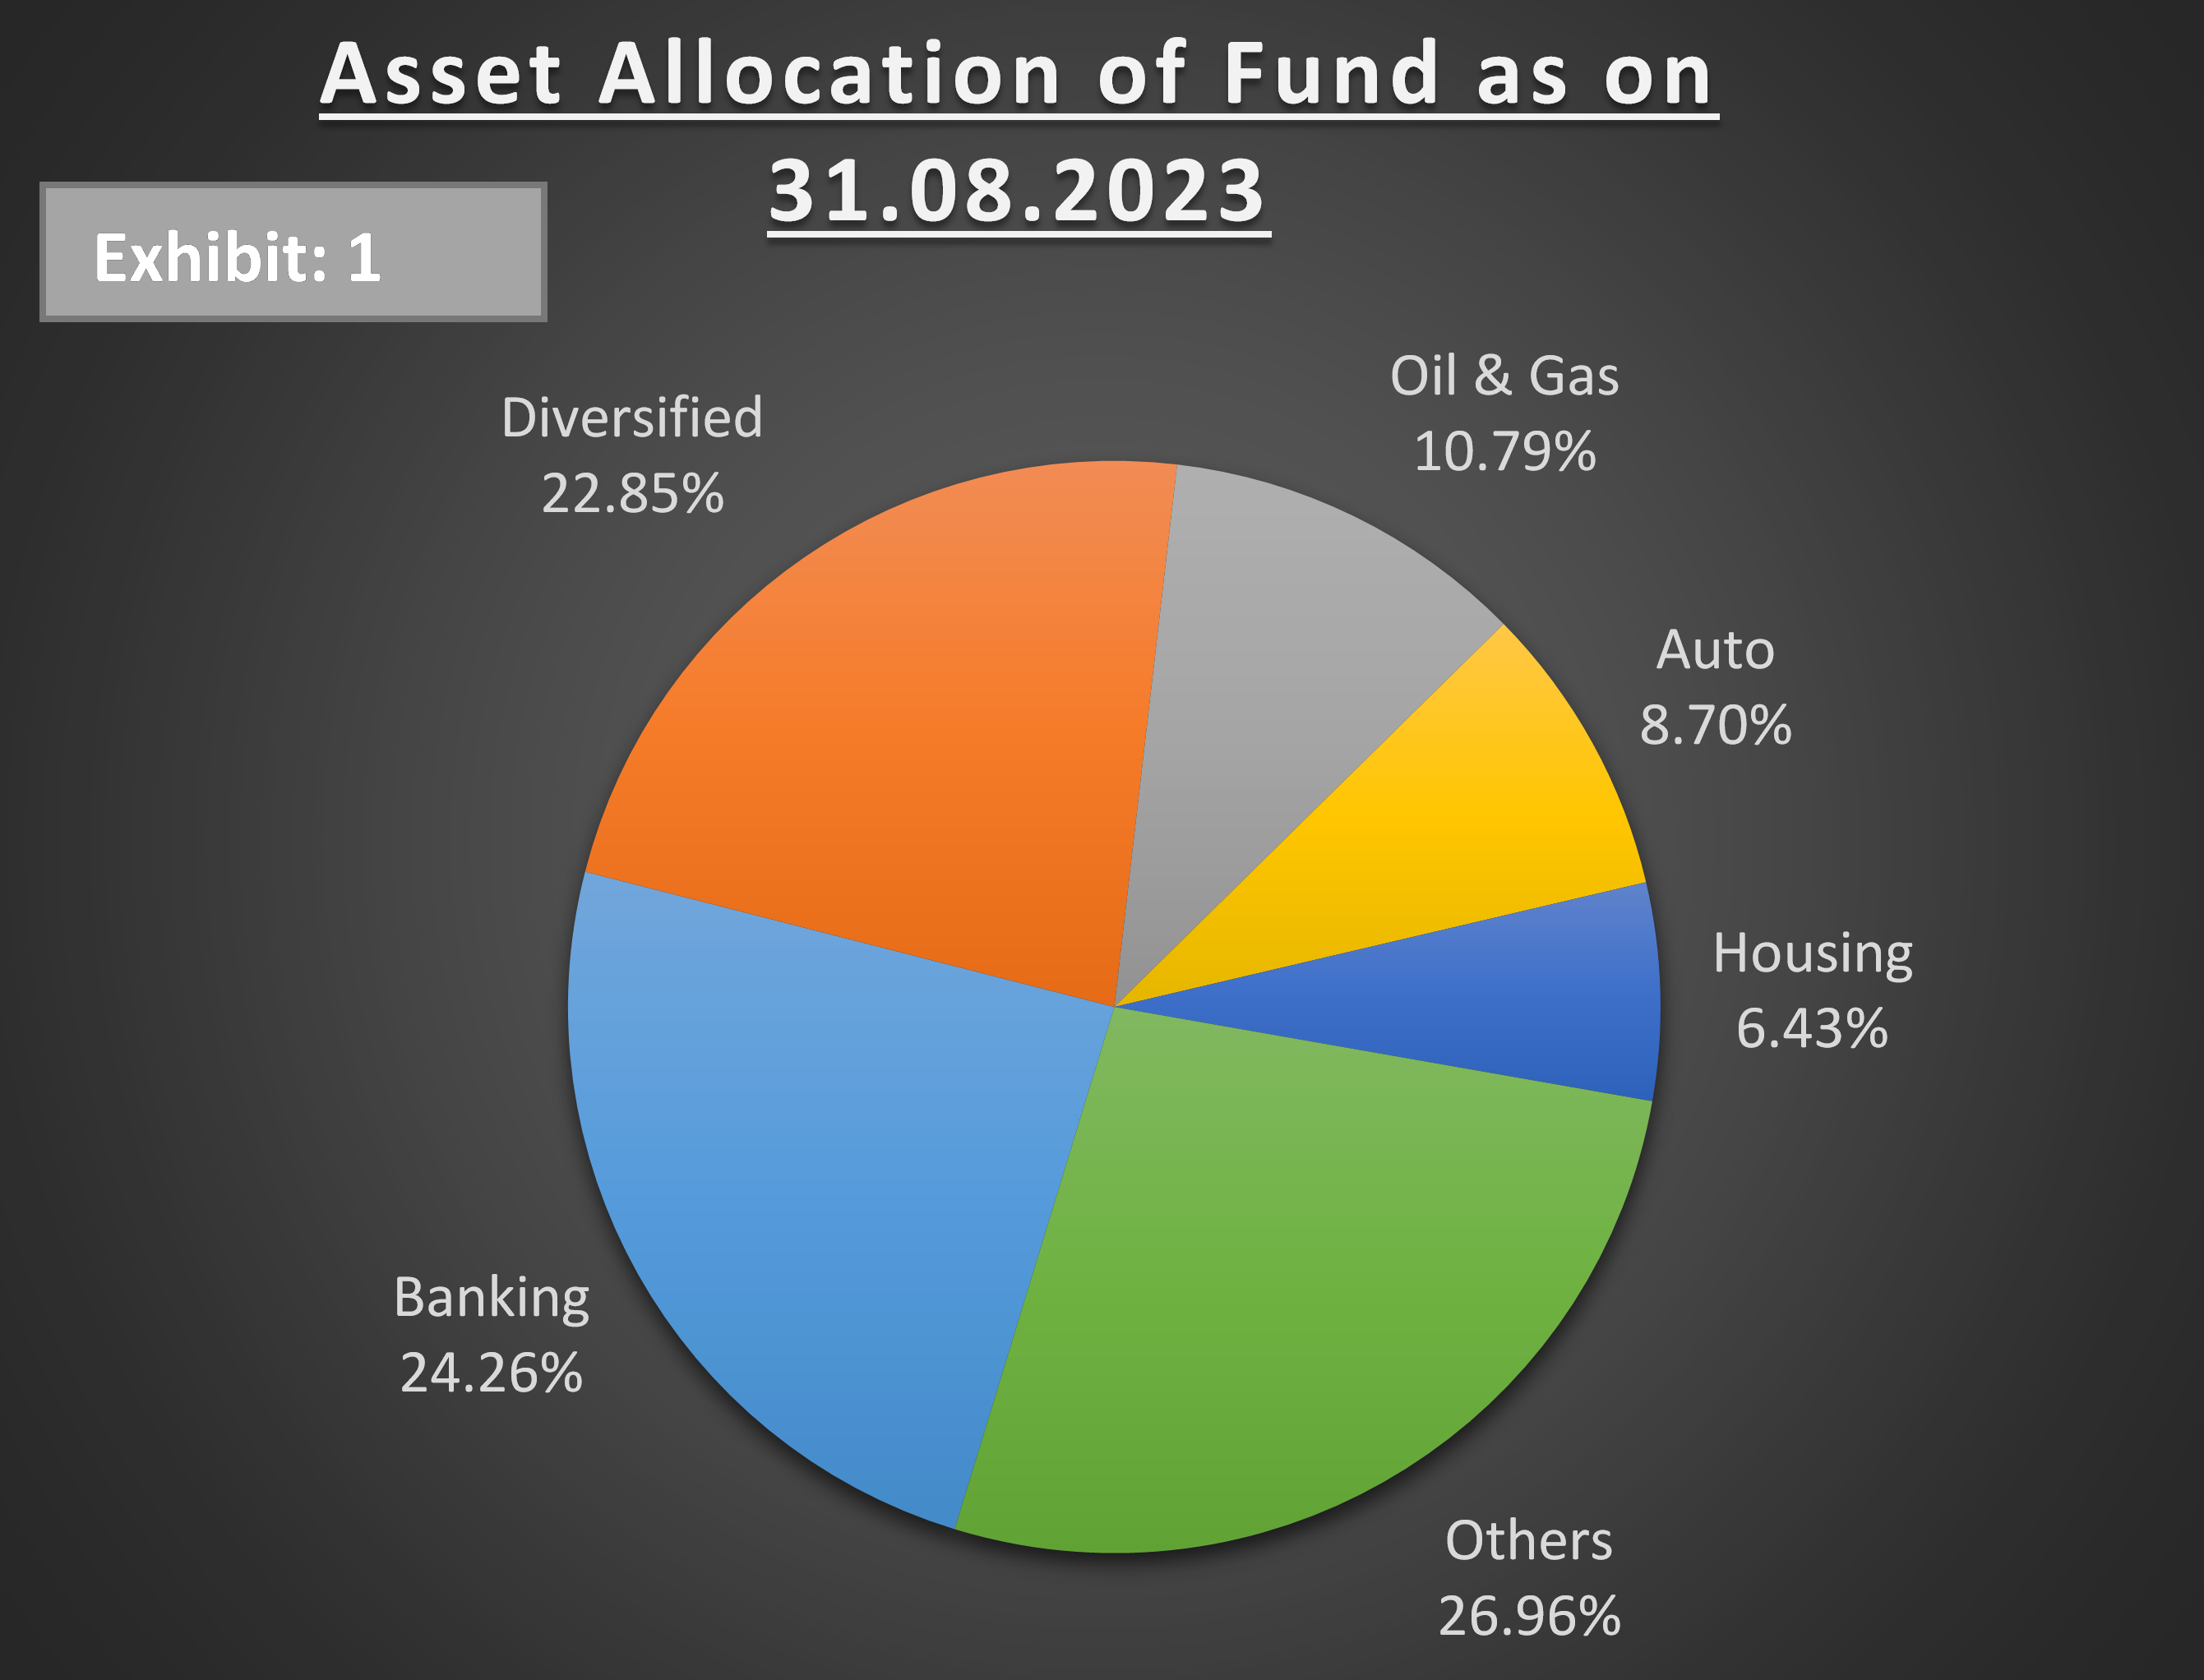
| Sectoral Allocation (in %) as on 31.08.2023 | |
|---|---|
| Top 10 holdings of Fund (Exhibit 1) | Fund Allocation |
| Banking | 24.26 |
| Diversified | 22.85 |
| Oil & Gas | 10.79 |
| Auto | 8.70 |
| Housing | 6.43 |
| IT | 6.07 |
| Power | 4.57 |
| Capital Goods | 4.02 |
| Telecom | 3.73 |
| FMCG | 3.22 |
| Month End | Equity % | Debt % | Cash % | Scheme % Returns (Monthly) | Category Avg% Returns (Monthly) |
|---|---|---|---|---|---|
| 31.05.2023 | 70.49 | 18.98 | 10.53 | 2.82 | 2.17 |
| 28.04.2023 | 73.23 | 16.21 | 10.57 | 3.56 | 3.90 |
| 31.03.2023 | 74.67 | 17.51 | 7.82 | 0.14 | 0.23 |
| 28.02.2023 | 71.78 | 18.37 | 9.86 | 0.19 | -0.27 |
| 31.01.2023 | 70.17 | 13.74 | 16.10 | -1.27 | -1.06 |
| 30.12.2022 | 72.97 | 14.86 | 12.17 | -2.03 | -1.51 |
| 30.11.2022 | 74.82 | 15.51 | 9.67 | 2.76 | 2.32 |
| 28.10.2022 | 75.12 | 16.71 | 8.17 | 2.80 | 2.57 |
| 30.09.2022 | 74.22 | 18.86 | 6.91 | -1.60 | -1.47 |
| 31.08.2022 | 75.58 | 15.85 | 8.56 | 2.55 | 2.44 |
| 29.07.2022 | 72.56 | 17.03 | 10.41 | 5.29 | 5.10 |
| 30.06.2022 | 70.23 | 16.46 | 13.31 | -2.64 | -2.40 |
| Top 10 Holdings (% in N.A) | Aug-23 | Feb-22 | Sept-22 |
|---|---|---|---|
| ICICI Bank Ltd. | 5.74 | 4.13 | 5.46 |
| HDFC Bank Ltd. | 4.81 | 7.27 | 7.81 |
| Maruti Suzuki India Ltd. | 4.46 | 2.59 | 1.04 |
| Bharti Airtel Ltd. | 3.73 | 4.51 | 6.39 |
| National Thermal Power Corporation Ltd. | 3.58 | 3.81 | 3.26 |
| Reliance Industries Ltd. | 3.41 | 3.50 | 2.11 |
| Infosys Ltd. | 3.40 | 3.10 | 3.27 |
| TVS Motor Company Ltd. | 2.53 | 2.66 | 2.88 |
| Sun Pharmaceuticals Ind Ltd. | 2.53 | 1.05 | 0.77 |
| Oil & Natural Gas Corporation Ltd. | 2.45 | 3.19 | 2.82 |
PORTFOLIO ANALYSIS
ICICI Prudential Mutual Fund is the second-largest asset management company in India. In the latest portfolio, the fund held 78 scrips as on August 2023. The Scheme follows a blend of top-down and bottom-up approaches to in-stock selection. The focus of the top-down approach is alpha generation through active Sectoral rotation. While a bottom-up seeks to identify companies with reasonable profitability and scalability supported by sustainable competitive advantages. The fund has major sectoral exposure to Banks, Oil & Gas, Automobile, Diversified sectors. The fund's top 5 holdings are in ICICI Bank Ltd., HDFC Bank Ltd., Maruti Suzuki India Ltd., Bharti Airtel Ltd., National Thermal Power Corp. Ltd. Risk-O-Meter shown for this fund is very high.
Table 1 above tabulates the allocation of top 10 sectors by the fund. The fund has an allocation to 15 sectors, wherein the top 5 sectors constitutes to 73.04%. The fund could outperform its benchmark index in 06 out of 12 months during the last one year period, maintaining an average equity exposure of 92.74%.
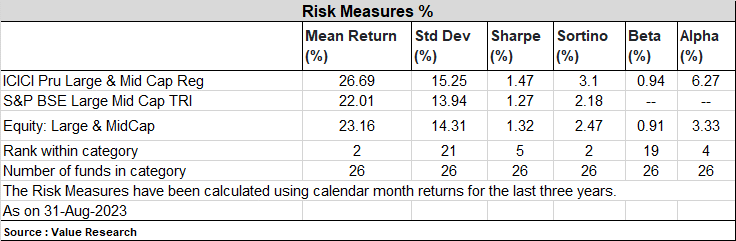
The risk parameter graph measures standard deviation (S.D.) across all the Large & Midcap schemes. The S.D. of the scheme is 15.25%, which is higher than the industry average of the Large & Midcap schemes of 14.31%. The Sharpe ratio of the scheme is 1.47%, which is higher than the industry average 1.32%.
Monthly SIP and Lumpsum vis-à-vis Benchmark: Exhibit 2
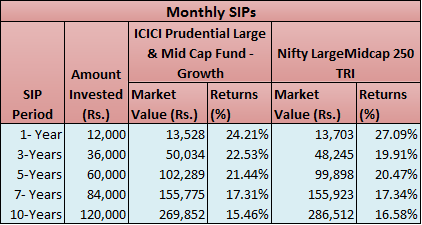
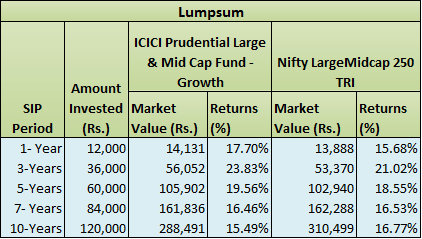
Note: (1) Performance is on August 31, 2023. (2) Returns are calculated on the basis of annual compounding. As it may be observed in Exhibit 2, the fund has outperformed in returns vis-à-vis its benchmark across all time frames. The returns of the fund in both modes (ie. Monthly and Lumpsum) across various time periods witnessed with mixed noticeable variations.
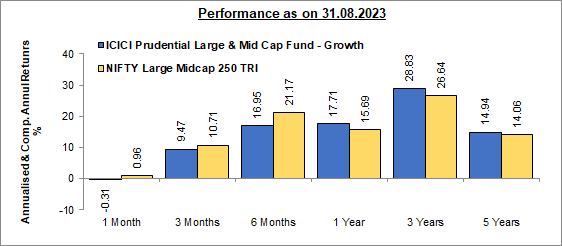
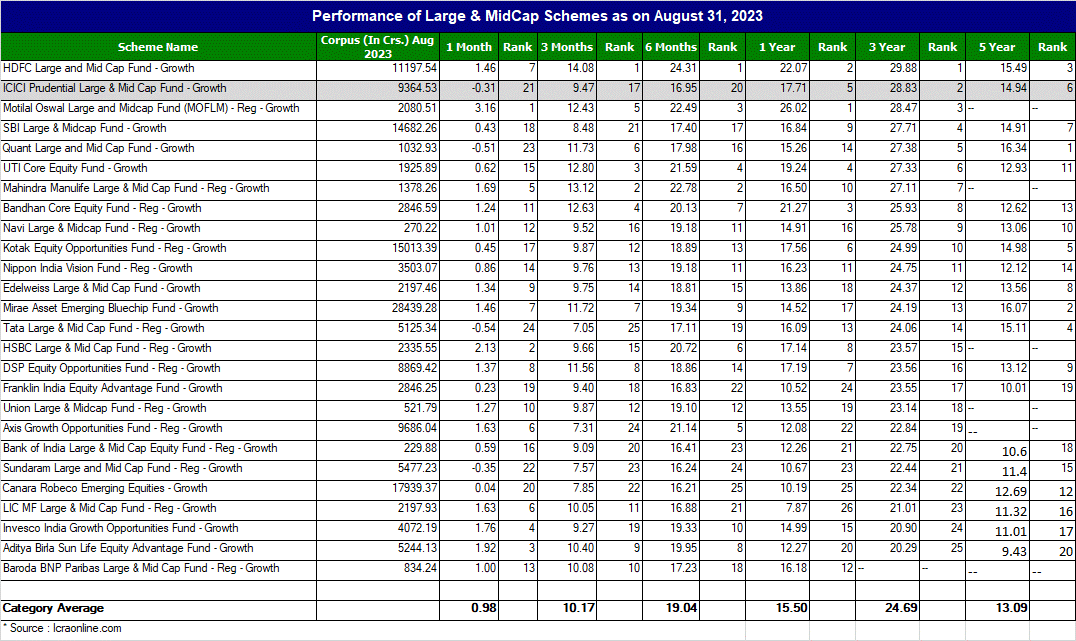
PERFORMANCE: In Exhibit 4, the scheme has outperformed its benchmark in all time horizons except for 1 month and 3 months horizon. The fund has outperformed the benchmark over the period of 3 years by generating a CAGR of 28.83%. This scheme provides an opportunity for higher capital appreciation over the long term. The major portfolio composition of large-cap stocks helps in reducing the overall portfolio volatility and provides less volatile and reasonable returns. The scheme's ability to deliver returns consistently is in-line with most funds of its category. Its ability to control losses in a falling market is high.
The fund is good for investors who want exposure to equity and equity-related instruments but with optimized risk. It helps an investor with long-term wealth creation in a much more stable way as compared to instruments with a higher risk appetite.
Please Note: The ratings mentioned in the report are declared by Value Research
PEER COMPARISON
Start your Investment journey with us
Disclaimer - Mutual Fund investments are subject to market risks, read all scheme related documents carefully.