Mirae Asset Emerging Bluechip Fund
Date Published: February 15, 2021
SMART INVESTOR GUIDE
FUND FACTS
| Nature | Open Ended | Fund Manager | Ankit Jain, Neelesh Surana |
| Launch Date | 9th July, 2010 | Benchmark Index | NIFTY Large Midcap 250 TRI |
| NAV (Rs.) | 57.79 ( 10-Sep-2020 ) | Corpus (Rs.in Crs.) | 11315.61 ( Aug-2020) |
| Investment Objective | The investment objective of the scheme is to generate income and capital appreciation from a portfolio primarily investing in Indian equities and equity related securities of large cap and mid cap companies at the time of investment. From time to time, the fund manager may also seek participation in other Indian equity and equity related securities to achieve optimal Portfolio construction. The Scheme does not guarantee or assure any returns. |
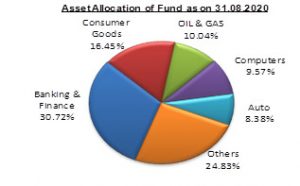
PORTFOLIO COMPOSITION
The fund has 99.51% of its net assets invested into equity & equity related instruments and balance 0.49% in cash. The large cap holdings constitute of 58.51% (market cap > Rs.19,728 crs), 35.76% in midcap (market cap > Rs.6937 and < Rs.19,728 crs), 4.15% in small cap (market cap 0 > Rs.6,937 crs), and balance 1.58% in debt and cash component. The top 10 holdings of the scheme constitute 39.16% of its net assets. It may be observed that the Quarterly Average AUM of the fund for the end of June 2020 is Rs.6094.73 crs.
| Table 1 | |
| Sectoral Allocation (in %) as on 27.11.2020 | |
| Top 10 holdings of Fund | Fund Allocation |
| Banking & Finance | 30.72 |
| Consumer Goods | 16.45 |
| OIL & GAS | 10.04 |
| Computers | 9.57 |
| Auto | 8.38 |
| Pharma | 7.11 |
| Capital Goods | 4.44 |
| Telecom | 3.37 |
| Housing | 2.36 |
| Power | 1.58 |
| Table 2 | |||||
| Month End | Equity % | Cash % | Debt % | Scheme Returns % | Index Returns % |
| 30-Aug-20 | 99.51 | 0.00 | 0.49 | 5.42 | 5.55 |
| 31-Jul-20 | 98.39 | 0.00 | 1.61 | 6.40 | 5.83 |
| 30-Jun-20 | 97.57 | 0.00 | 2.43 | 9.02 | 9.10 |
| 29-May-20 | 97.69 | 0.00 | 2.31 | -1.37 | 0.26 |
| 30-Apr-20 | 96.13 | 0.00 | 3.87 | 18.71 | 18.32 |
| 31-Mar-20 | 99.32 | 0.00 | 0.68 | -23.48 | -24.65 |
| 28-Feb-20 | 99.59 | 0.01 | 0.40 | -5.19 | -6.84 |
| 31-Jan-20 | 99.70 | 0.01 | 0.29 | 0.99 | 1.95 |
| 31-Dec-19 | 99.39 | 0.01 | 0.60 | 0.81 | 0.36 |
| 29-Nov-19 | 99.55 | 0.33 | 0.12 | 3.38 | 2.93 |
| 31-Oct-19 | 99.30 | 0.00 | 0.70 | 4.93 | 4.35 |
| 30-Sep-19 | 98.93 | 0.00 | 1.07 | 3.62 | 3.83 |
| Table 3 | |||
| Top 10 Holdings (% in N.A) | Nov-20 | May-20 | Dec-19 |
| HDFC Bank Ltd. | 7.09 | 6.88 | 7.08 |
| ICICI Bank Ltd. | 5.54 | 5.46 | 6.23 |
| Infosys Ltd. | 4.20 | 2.51 | 2.12 |
| Axis Bank Ltd. | 4.17 | 4.54 | 3.69 |
| Reliance Industries Ltd. | 3.80 | 4.76 | 3.64 |
| Bharti Airtel Ltd. | 3.37 | – | – |
| Tata Consultancy Services Ltd. | 2.91 | 2.37 | 2.30 |
| Max Financial Services Ltd. | 2.77 | 2.73 | 2.35 |
| State Bank of India | 2.74 | 4.23 | 4.02 |
| Voltas Ltd. | 2.60 | 3.04 | 3.24 |
PORTFOLIO ANALYSIS
The fund with a beta of 0.95 has a weighted market cap of Rs 2,32,099 crores as on August 31, 2020. The PE of the fund is 42.62 as on August 31, 2020. The fund holds a portfolio of around 59 stocks spread across market capitalisation. Large cap names like HDFC Bank, ICICI Bank, Reliance Industries, Axis Bank and SBI appear among its top holdings. While picking stocks for the portfolio, the fund aims to hold a well-diversified portfolio without having any bias towards any particular theme, sector or style. The one-year return of the fund is 12.39% as against 8.23% of the benchmark index. In the same period, the fund increased its NAV holding substantially in the stocks like Havells India Ltd, Titan Company Ltd, Coal India Ltd, Ceat Ltd, Infosys Ltd, SRF Ltd. Ltd by 396%, 222%, 150%, 119%, 98% and 86% respectively. During its current portfolio (Aug 2020), it has been witnessed that there were no new additions or deletion of stocks. In the latest portfolio, the fund held 59 scrips, out of which 55 scrips were held since one-year period (Aug-2020 to Sept-2019). Churning of the portfolio was not observed much in this portfolio during the last one year.
Table 1 above tabulates the allocation of top 10 sectors by the fund. The fund has an allocation to 16 sectors, wherein the top 5 sectors constitutes to 75.17%. The fund could outperform its benchmark index in only 07 out of 12 months during the last one year period, maintaining an average equity exposure of 98.76%.
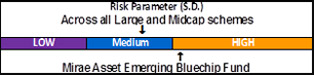
The risk parameter graph measures standard deviation (S.D.) across all the Large and Midcap schemes. The S.D. of the scheme is 13.55%, which is higher than the industry average of the Large and Midcap schemes of 13.09%. The Sharpe ratio of the scheme is 0.14%, which is higher than the industry average of -0.29%.
Monthly SIP and Lumpsum vis-à-vis Benchmark: Exhibit 2
| Monthly SIPs Min (Rs.1000 p.m.) | |||||
| SIP Period | Amt Invst. (Rs.) | Canara Robeco Bluechip Equity Fund (Rs.) | S&P BSE 100 TRI(Rs.) | ||
| Market Value | Rets (%) | Market Value | Rets (%) | ||
| 1-Yr. | 12,000 | 13,255 | 19.81% | 13,032 | 16.22% |
| 3-Yr. | 36,000 | 40,906 | 8.45% | 37,820 | 3.22% |
| 5-Yr. | 60,000 | 80,466 | 11.67% | 71,406 | 6.89% |
| 7-Yr. | 84,000 | 1,49,639 | 16.19% | 1,17,305 | 9.37% |
| 10- Yr. | 1,20,000 | 3,30,348 | 19.22% | 2,13,983 | 11.13% |
| Lumpsum (Matching Monthly SIP) | |||||
| SIP Period | Amt Invst. (Rs.) | Canara Robeco Bluechip Equity Fund (Rs.) | S&P BSE 100 TRI(Rs.) | ||
| Market Value | Rets (%) | Market Value | Rets (%) | ||
| 1-Yr. | 12,000 | 13,495 | 12.42% | 12,993 | 8.25% |
| 3-Yr. | 36,000 | 41,516 | 7.29% | 37,694 | 2.31% |
| 5-Yr. | 60,000 | 83,117 | 11.05% | 72,178 | 6.21% |
| 7-Yr. | 84,000 | 1,72,174 | 18.01% | 1,26,592 | 10.26% |
| 10- Yr. | 1,20,000 | 3,59,992 | 19.33% | 2,26,381 | 11.27% |
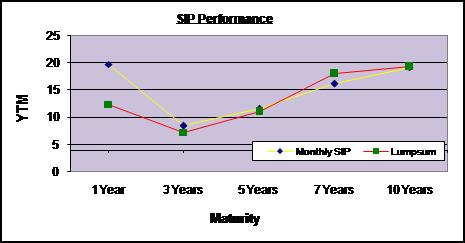
Note: (1) Performance is on August 31, 2020. (2) Returns are calculated on the basis of annual compounding.
As it may be observed in Exhibit 2, the fund has outperformed in returns vis-à-vis its benchmark across all time frames. The returns of the fund in both modes (ie. Monthly and Lumpsum) across various time periods witnessed with mixed noticeable variations.
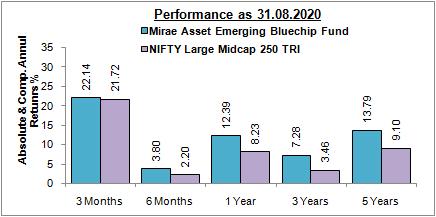
PERFORMANCE
In Exhibit 4, the scheme has outperformed the benchmark index in all the time horizons. The fund has outperformed its peers and category average across all time frames. It used to focus mostly on mid-cap stocks earlier, but after SEBI’s new norms on classification of funds, the fund has invested a majority of its corpus in large-cap stocks. Its mandate of investing a minimum 35 per cent in large-cap stocks, up to a maximum of 65 per cent and a minimum of 35 per cent in mid-cap stocks helps the fund manager invest in stocks across the listed space to extract decent returns. Large-cap stocks have been performing better than mid- and small-cap stocks for the past 18 months or so. In the past 3 years, following a diverse portfolio strategy, fund manager has enhanced exposure to companies in Auto, financials, Computers, Consumer Goods, Oil &Gas and Pharma sectors. The fund employs a bottom-top approach while selecting stocks, focusing more on the performance of individual stocks rather than the industry as a whole. The fund’s compounded annual return of 13.79 per cent in the last five years is well above the category average return of 7.40 per cent. Its consistent show and ability to contain downsides makes it a safer bet in the risky large and mid-cap space.
Investors looking to take exposure to large- and mid-cap stocks and build wealth in the long term can invest in the Mirae Asset Emerging Bluechip Fund.
Please Note: The ratings mentioned in the report are declared by Value Research and Crisil has ranked 1 for this fund (For the quarter ended June 30, 2020).
PEER COMPARISON

Start your Investment journey with us
Disclaimer - Mutual Fund investments are subject to market risks, read all scheme related documents carefully.