Mirae Asset Focused Fund
Date Published: February 15, 2021
SMART INVESTOR GUIDE
FUND FACTS
| Nature | Open Ended | Fund Manager | Gaurav Misra |
| Launch Date | 14-May-2019 | Benchmark Index | Nifty 200 TRI |
| NAV (Rs.) | 13.54 ( 27-Nov -2020 ) | Corpus (Rs.in Crs.) | 4172.99 ( Nov-2020 ) |
| Investment Objective | To generate long term capital appreciation/income by investing in equity & equity related instruments of up to 30 companies. There is no assurance that the investment objective of the Scheme will be realized. |
PORTFOLIO COMPOSITION
The fund has 96.61% of its net assets invested into equity & equity related instruments, balance 3.39% in cash component. The large cap holdings constitute of 66.10% (market cap > Rs.26,595 crs), 26.53% in midcap (market cap > Rs.6937 and < Rs.26,595 crs), 3.72% in smallcap (market cap< Rs.6937 crs) and balance 3.65% in cash component. The top 10 holdings of the scheme constitute 54.55% of its net assets. It may be observed that the Quarterly Average AUM of the fund for the end of September 2020 is Rs.2735.40 crores.

| Table 1 | |
| Sectoral Allocation (in %) as on 27.11.2020 | |
| Top 10 holdings of Fund | Fund Allocation |
| Banks | 30.60 |
| Consumer Goods | 13.56 |
| OIL & GAS | 12.35 |
| IT | 10.60 |
| Pharma | 7.16 |
| Auto | 6.93 |
| Capital Goods | 4.55 |
| Telecom | 4.18 |
| Cement | 2.94 |
| Housing | 2.39 |
| Table 2 | |||||
| Month End | Equity % | Cash % | Debt % | Scheme Returns % | Index Returns % |
| 27/11/2020 | 96.61 | – | 3.39 | 9.40 | 9.96 |
| 30/10/2020 | 98.34 | – | 1.66 | 2.76 | 3.03 |
| 30/09/2020 | 98.29 | – | 1.71 | -2.02 | -3.07 |
| 31/08/2020 | 96.14 | – | 3.86 | 4.49 | 3.13 |
| 31/07/2020 | 94.43 | – | 5.57 | 8.21 | 7.03 |
| 30/06/2020 | 95.87 | – | 4.13 | 10.91 | 7.60 |
| 29/05/2020 | 96.28 | – | 3.72 | 0.28 | 0.56 |
| 30/04/2020 | 97.47 | – | 2.53 | 18.14 | 18.95 |
| 31/03/2020 | 97.75 | – | 2.25 | -23.89 | -22.74 |
| 28/02/2020 | 98.49 | – | 1.51 | -6.90 | -7.28 |
| 31/01/2020 | 96.76 | 0.93 | 2.31 | 0.44 | -0.74 |
| 31/12/2019 | 92.60 | 1.03 | 6.37 | 0.79 | 0.54 |
| Table 3 | |||
| Top 10 Holdings (% in N.A) | Nov-20 | May-20 | Dec-19 |
| HDFC Bank Ltd. | 11.02 | 10.05 | 7.42 |
| Infosys Ltd. | 7.86 | 6.37 | 4.82 |
| ICICI Bank Ltd. | 7.84 | 6.64 | 5.37 |
| Reliance Industries Ltd. | 7.59 | 8.85 | 3.05 |
| Bharti Airtel Ltd. | 4.18 | – | – |
| Torrent Pharmaceuticals Ltd. | 3.58 | 2.38 | 2.14 |
| Britannia Industries Ltd. | 3.26 | 3.87 | 3.28 |
| Maruti Suzuki India Ltd. | 3.21 | 4.11 | 2.37 |
| Bharat Electronics Ltd. | 3.06 | 2.87 | – |
| J K Cement Ltd. | 2.94 | 2.76 | 2.69 |
PORTFOLIO ANALYSIS
The fund with a beta of 0.75 has a weighted market cap of Rs 2,97,944.80 crores as on November 27, 2020. The PE of the fund is 46.57 as on November 27, 2020. In the latest portfolio, the fund holds 31 scrips, of which the fund stayed invested in 26 scrips during one year period (Dec-2019 to Nov-2020) without much considerable churning. The fund holds 31 scrips with around 66% invested only in large-cap stocks in its current portfolio. Of the top 10 holdings, HDFC Bank Ltd, Infosys Ltd, ICICI Bank Ltd, Reliance Industries Ltd remained in top invested in all the scrips throughout the year. The fund latest added Gland Pharma Ltd and exited Emami Ltd during its current portfolio (Nov 2020) .Top five sectors account for over 74% of the portfolio investments. The one-year return of the fund is 15.18% as against 9.09% of the benchmark index. During the one-year period, the fund’s exposure to the scrips such as Torrent Pharmaceuticals Ltd (3.58%), Infosys Ltd (7.86%), Kansai Nerolac Paints Ltd (2.56%), HDFC Bank Ltd (11.02%) and ICICI Bank Ltd. (7.84%) gained by 67%, 63%, 50%, 48% and 46% which contributed to the one-year return’s performance.
Table1 above tabulates the allocation of top sectors by the fund. The fund has an allocation to 10 sectors, wherein the top 5 sectors constitutes to 74.26%. The fund could outperform its benchmark index in only 07 out of 12 months during the last one year period, maintaining an average equity exposure of 96.5994.71%.
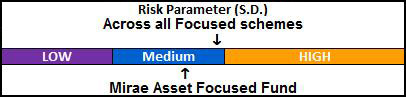
The risk parameter graph measures standard deviation (S.D.) across all the Equity Focused schemes. The S.D. of the scheme 10.09%, which is lower than the industry average of the Equity Focused schemes of 11.75%. The Sharpe ratio of the scheme is 0.19%, which is higher than the industry average of -0.09%.
Monthly SIP and Lumpsum vis-à-vis Benchmark: Exhibit 2
| Monthly SIPs Min (Rs.1000 p.m.) | |||||
| SIP Period | Amt Invst. (Rs.) | Canara Robeco Bluechip Equity Fund (Rs.) | S&P BSE 100 TRI(Rs.) | ||
| Market Value | Rets (%) | Market Value | Rets (%) | ||
| 1-Yr. | 12,000 | 14,976 | 49.33% | 14,528 | 41.55% |
| Lumpsum (Matching Monthly SIP) | |||||
| SIP Period | Amt Invst. (Rs.) | Canara Robeco Bluechip Equity Fund (Rs.) | S&P BSE 100 TRI(Rs.) | ||
| Market Value | Rets (%) | Market Value | Rets (%) | ||
| 1-Yr. | 12,000 | 13,851 | 15.47% | 13113 | 9.30% |
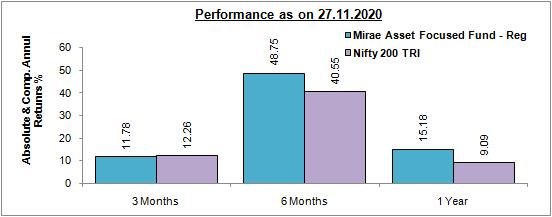
PERFORMANCE
In Exhibit 3, the scheme has outperformed the benchmark index in 6 months and 1 year horizons. The fund has outperformed its category average for the period of 3months, 6months and 1 yr respectively. As per SEBI regulations, a focused fund is not allowed to hold more than 30 stocks and invests a minimum of 65% of its assets in equity and equity related instruments. The fund will allocate its assets as per the given prescribed limits in equities and will also allocate some portion (up to 35% of its total assets) to debt and money market instruments from an asset allocation standpoint and to mitigate the risk. The fund manager will follow a focused approach on the investments. The investments will be limited to a maximum of 30 stocks. The fund has the flexibility to invest across market capitalization in large cap, mid cap and small cap category. The focus would be to build a portfolio of strong growth companies, reflecting our most attractive investment ideas at all points of time. Even though the fund has the option to invest in equity derivatives instruments for hedging or balancing the portfolio to optimize returns and mitigate the risk involved.
Investors looking to take exposure to focused stocks and build wealth in the long term can invest in the Mirae Asset Focused Fund and is suggested for SIP over next 2 years.
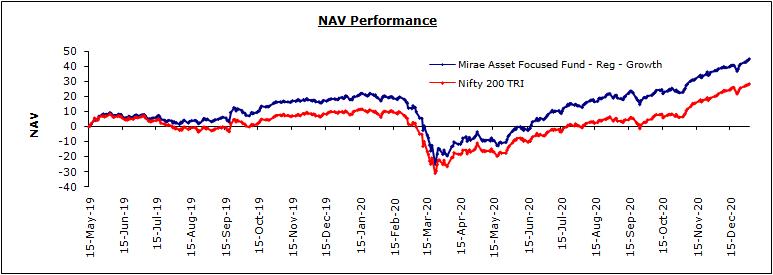
NAV MOVEMENT VIS-À-VIS BENCHMARK
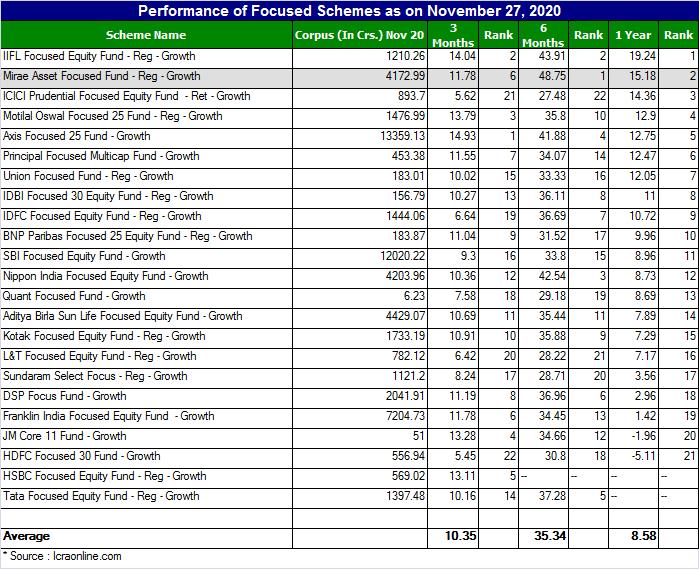
PEER COMPARISON
Start your Investment journey with us
Disclaimer - Mutual Fund investments are subject to market risks, read all scheme related documents carefully.