Motilal Oswal Long Term Equity Fund
Date Published: February 16, 2021
SMART INVESTOR GUIDE
FUND FACTS
| Nature | Open Ended | Fund Manager | Abhiroop Mukherjee, Aditya Khemani |
| Launch Date | 21-Jan-2015 | Benchmark Index | Nifty 500 TRI |
| NAV (Rs.) | 14.48 ( 29-May-2020 ) | Corpus (Rs.in Crs.) | 1385.61 ( May-2020 ) |
| Investment Objective | The investment objective of the Scheme is to generate long-term capital appreciation from a diversified portfolio of predominantly equity and equity related instruments. However, there can be no assurance or guarantee that the investment objective of the Scheme would be achieved. |
PORTFOLIO COMPOSITION
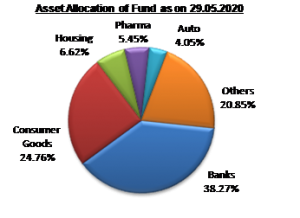
The fund has 99.54% of its net assets invested into equity & equity related instruments and 0.46% in cash component in its current’s portfolio ie May 2020. The large cap holdings constitute of 67.19% (market cap > Rs.25,587 crs), 29.10% in midcap (market cap > Rs.8,227 and < Rs.25,587 crs), 3.26% in small cap (0 >Rs.8227) and balance 0.46% in cash component. The top 10 holdings of the scheme constitute 55.05% of its net assets. It may be observed that the Quarterly Average AUM of the fund for the end of March 2020 is Rs.1161.73 crs.
| Table 1 | |
| Sectoral Allocation (in %) as on 29.05.2020 | |
| Top 10 holdings of Fund | Fund Allocation |
| Auto | 4.05 |
| Banks | 38.27 |
| Cement | 4.04 |
| Consumer Goods | 24.76 |
| Diversified | 10.06 |
| Housing | 6.62 |
| Pharma | 5.45 |
| Telecom | 3.83 |
| Textiles | 2.93 |
| Table 2 | |||||
| Month End | Equity % | Debt % | Cash % | Scheme Returns % | Index Returns % |
| 31-May-20 | 99.54 | — | 0.46 | -1.43 | 0.39 |
| 30-Apr-20 | 95.26 | — | 4.74 | 13.20 | 18.74 |
| 31-Mar-20 | 97.82 | — | 2.18 | -26.14 | -23.28 |
| 28-Feb-20 | 99.59 | — | 0.41 | -3.21 | -7.18 |
| 31-Jan-20 | 99.33 | — | 0.67 | 2.80 | -0.10 |
| 31-Dec-19 | 98.41 | — | 1.59 | 1.26 | 0.59 |
| 30-Nov-19 | 97.35 | — | 96.97 | -0.05 | 2.28 |
| 31-Oct-19 | 96.97 | — | 3.03 | 4.23 | 3.87 |
| 30-Sep-19 | 99.17 | 0.02 | 0.81 | 6.71 | 4.07 |
| 30-Aug-19 | 98.71 | 0.03 | 1.27 | 2.82 | -0.08 |
| 31-Jul-19 | 94.58 | — | 5.42 | -5.81 | -5.72 |
| 28-Jun-19 | 96.57 | — | 3.43 | 0.65 | -1.42 |
| Table 3 | |||
| Top 10 Holdings (% in N.A) | May-20 | Nov-19 | June-19 |
|---|---|---|---|
| HDFC Bank Ltd. | 8.10 | 9.37 | 9.36 |
| ICICI Bank Ltd. | 7.65 | 10.20 | 5.97 |
| Hindustan Unilever Ltd. | 7.13 | 2.85 | – |
| United Breweries Ltd. | 5.72 | 4.05 | – |
| Torrent Pharmaceuticals Ltd. | 5.45 | 2.64 | |
| Jubilant Foodworks Ltd | 5.02 | 3.52 | – |
| Muthoot Finance Ltd. | 4.30 | 1.88 | – |
| Maruti Suzuki India Ltd. | 4.05 | 4.96 | 3.71 |
| Bharti Airtel Ltd. | 3.83 | – | – |
| Axis Bank Ltd. | 3.81 | 7.86 | 3.91 |
PORTFOLIO ANALYSIS
The fund with a beta of 0.88 has a weighted market cap of Rs 1,44,349 crores as on May 29, 2020. The PE of the fund is 0.03 as on May 29, 2020. The fund holds a concentrated portfolio of less than 30 stocks, with the top 10 stocks making up more than half the portfolio. However, the fund mandate does not limit the number of stocks it can hold. Given its concentration on a small number of stocks, the fund follows a very stock-specific buy-and-hold approach. The fund can swing fairly quickly between marketcap allocations over the months. The one-year return of the fund is -15.49% against -18.73% of the benchmark index. The gain of the scheme could be attributed to the fund being overweight on the stocks like Max Financial Services Ltd, ICICI Bank Ltd and ICICI Lombard General Insurance Company Ltd. which gained by 38.86%, 28.14% & 19.10% respectively during the period. On the sectoral front, the fund increased its exposure in Consumer Goods to 24.76% from 15.42%, Housing to 6.62% from 5.61% and Pharma to 5.45% from 2.20% during the one year time horizon. The fund manager has one new stocks ie Bharti Airtel Ltd in its current portfolio. A concentrated strategy can result in strong outperformance if stocks with heavy weights do well. However, the fund will have a smaller cushion to absorb the effect of stocks underperforming.
Table 1 above tabulates the allocation of top 09 sectors by the fund. The fund has an allocation to 09 sectors, wherein the top 5 sectors constitutes to 79.15%. The fund could outperform its benchmark index in only 07 out of 12 months during the last one year period, maintaining an average equity exposure of 97.77%.
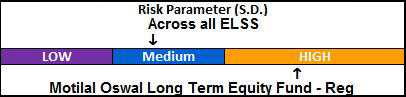
TThe risk parameter graph measures standard deviation (S.D.) across all the ElSS schemes. The S.D. of the scheme is 14.32%, which is higher than the industry average of the ELSS schemes of 12.54%. The Sharpe ratio of the scheme is -0.15%, which is higher than the industry average of –0.32%.
Monthly SIP and Lumpsum vis-à-vis Benchmark: Exhibit 2
| Monthly SIPs Min (Rs.1000 p.m.) | |||||
| SIP Period | Amt Invst. (Rs.) | Motilal Oswal Long Term Equity Fund (Rs.) | Nifty 500 TRI (Rs.) | ||
| Market Value | Rets (%) | Market Value | Rets (%) | ||
| 1-Yr. | 12,000 | 10,155 | -27.23% | 10,369 | -24.21% |
| 3-Yr. | 36,000 | 30,508 | 0.00% | 31,446 | 0.00% |
| 5-Yr. | 60,000 | 59,725 | -0.18% | 59,698 | -0.20% |
| Lumpsum (Matching Monthly SIP) | |||||
| SIP Period | Amt Invst. (Rs.) | Motilal Oswal Long Term Equity Fund (Rs.) | Nifty 500 TRI (Rs.) | ||
| Market Value | Rets (%) | Market Value | Rets (%) | ||
| 1-Yr. | 12,000 | 10,046 | -16.32% | 9699 | -19.22% |
| 3-Yr. | 36,000 | 30,563 | -7.98% | 31,695 | -6.24% |
| 5-Yr. | 60,000 | 61,708 | 0.94% | 60,541 | 0.30% |
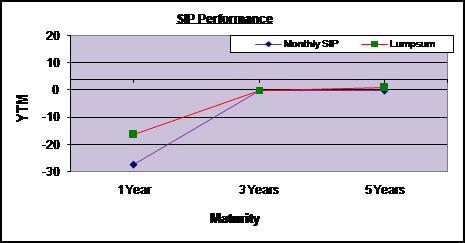
Note: (1) Performance is as on May 29, 2020. (2) Returns are calculated on the basis of annual compounding.
As it may be observed in Exhibit 2, the fund has outperformed in returns vis-à-vis its benchmark across all time frames. The returns of the fund in both modes (ie. Monthly and Lumpsum) across various time periods witnessed with mixed noticeable variations.
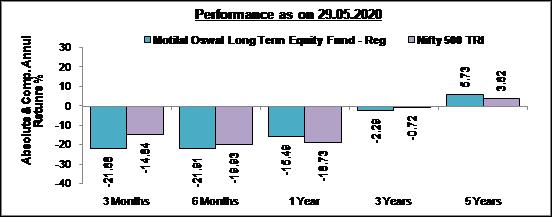
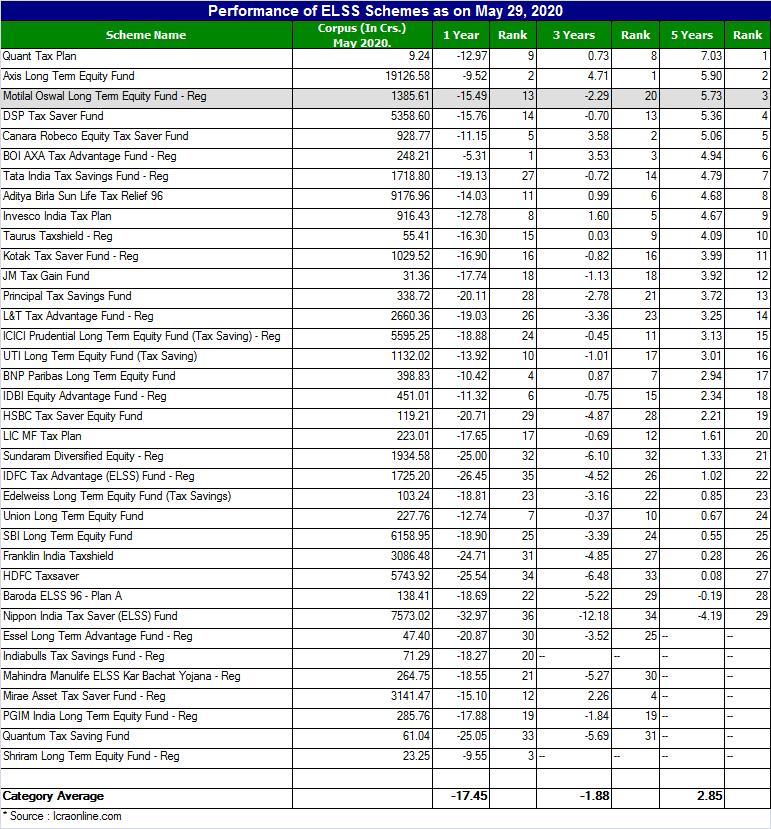
PERFORMANCE
In Exhibit 4, the scheme has outperformed the benchmark index in 1 year and 5 years time horizon. However, it has underperformed its benchmark in 3, 6 months and 3 years period. The fund has outperformed category average across time frames (one, three and five years). The scheme does not take too much exposure to small-cap stocks and generally restricts itself to quality large cap stocks. Over the last five years, it has given an annualised return of 5.73 per cent as against 3.62 per cent by its benchmark. The fund has raised the exposure in midcap cap stocks from 19% in the month of June 2019 to 29% in the month of May 2020. The fund could protect the downside well mainly because of its higher exposure in largecap stocks in its portfolio and small portion in its mid cap stocks.
Over the past year, the fund preferred sectors such as Banks, Consumer Goods, and Housing in the latest portfolio in which only these sectors accounted for 70 per cent of the assets.
The fund suits those with a higher risk appetite. Investments in tax-saving funds have a lock-in for 3 years but a longer time frame of 5 years or more will help deliver better returns.
Please Note: The ratings mentioned in the report are declared by Value Research and Crisil has ranked 3 for this fund (For the quarter ended March 31, 2020).
PEER COMPARISON
Start your Investment journey with us
Disclaimer - Mutual Fund investments are subject to market risks, read all scheme related documents carefully.