Aditya Birla Sun Life Equity Advantage Fund
Date Published: February 11, 2021
SMART INVESTOR GUIDE
FUND FACTS
| Nature | Open Ended | Fund Manager | Satyabrata Mohanty |
| Launch Date | 24-Feb-1995 | Benchmark Index | NIFTY Large Midcap 250 TRI |
| NAV (Rs.) | 331.85 ( 29-May-2020 ) | Corpus (Rs.in Crs.) | 3792.67 ( May-2020 ) |
| Investment Objective | To generate capital appreciation from a portfolio of predominantly equity and equity related securities falling under the category of large Cap companies. There is no assurance that the investment objective of the Scheme will be achieved. |
PORTFOLIO COMPOSITION
The fund has 98.99% of its net assets invested into equity & equity related instruments, 0.33% in debt component and balance 0.69% in cash in its current’s portfolio ie May 2020. The large cap holdings constitute of 58.58% (market cap > Rs.25,587 crs), 35.89% in midcap (market cap > Rs.8,227 and < Rs. 25,587 crs), 3.41% in smallcap (0 >Rs.8227) and balance 2.12% in debt and cash component. The top 10 holdings of the scheme constitute 42.52% of its net assets. It may be observed that the Quarterly Average AUM of the fund for the end of March 2020 is Rs.3360.04 crs.

| Table 1 | |
| Sectoral Allocation (in %) as on 29.05.2020 | |
| Top 10 holdings of Fund | Fund Allocation |
| Banks | 24.47 |
| Consumer Goods | 20.18 |
| Computers | 8.84 |
| Cement | 8.23 |
| Telecom | 6.18 |
| Pharma | 6.00 |
| Auto | 4.60 |
| Chemicals | 2.79 |
| Capital Goods | 2.65 |
| Fertilizers | 2.38 |
| Table 2 | |||||
| Month End | Equity % | Debt % | Cash % | Scheme Returns % | Index Returns % |
| 31-May-20 | 98.99 | 0.33 | 0.69 | -0.62 | 0.26 |
| 30-Apr-20 | 99.04 | 0.51 | 0.46 | 16.62 | 18.32 |
| 31-Mar-20 | 98.58 | 0.40 | 1.02 | -27.71 | -24.65 |
| 28-Feb-20 | 99.24 | 0.29 | 0.48 | -4.22 | -6.84 |
| 31-Jan-20 | 98.66 | 0.27 | 1.07 | 3.54 | 1.95 |
| 31-Dec-19 | 99.11 | 0.26 | 0.63 | -0.37 | 0.36 |
| 30-Nov-19 | 98.49 | 0.27 | 1.24 | 2.9 | 2.93 |
| 31-Oct-19 | 99.09 | 0.27 | 0.65 | 5.38 | 4.35 |
| 30-Sep-19 | 99.01 | 0.89 | 0.10 | 5.83 | 3.83 |
| 30-Aug-19 | 93.66 | 0.93 | 5.41 | -0.55 | 0.09 |
| 31-Jul-19 | 98.10 | 1.04 | 0.86 | -8.22 | -6.61 |
| 28-Jun-19 | 98.82 | 0.87 | 0.31 | -1.12 | -1.22 |
| Table 3 | |||
| Top 10 Holdings (% in N.A) | May-20 | Nov-19 | June-19 |
| Reliance Industries Ltd. | 6.36 | 7.78 | 1.77 |
| Bharti Airtel Ltd. | 6.18 | 1.05 | — |
| HDFC Bank Ltd. | 5.95 | 8.72 | 9.06 |
| ICICI Bank Ltd. | 4.20 | 10.32 | 8.46 |
| Info Edge Ltd. | 3.75 | 2.96 | 2.42 |
| Shree Cement Ltd. | 3.55 | 3.29 | 3.69 |
| Crompton Greaves Consumer Electricals Ltd. | 3.54 | 3.05 | 2.98 |
| Kotak Mahindra Bank Ltd. | 3.15 | — | — |
| Larsen & Toubro Infotech Ltd. | 3.05 | 1.99 | 2.03 |
| Atul Ltd. | 2.79 | 1.87 | 1.77 |

PORTFOLIO ANALYSIS
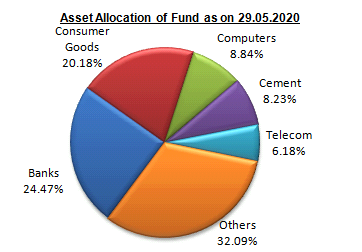
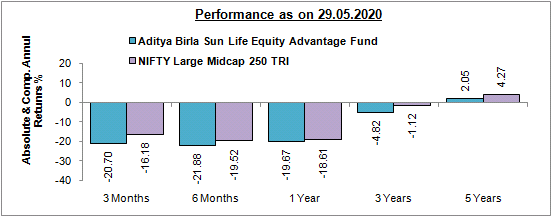
The fund with a beta of 0.94 has a weighted market cap of Rs 1,71,743 crores as on May 29, 2020. The PE of the fund is 36.99 as on May 29, 2020. In the latest portfolio, the fund held 49 scrips, out of which 31 scrips were held since one-year period (June-2019 to May-2020). During the past one year, the fund manager has been constant with the number of scrips, thereby showing not a major changes in the portfolio broad based. The top 5 large cap equity holdings are Reliance Industries Ltd. (6.36 percent), Bharti Airtel Ltd. (6.18 percent), HDFC Bank Ltd. (5.95 percent), ICICI Bank Ltd. (4.20 percent) and Info Edge Ltd. (3.75 percent) as on May 2020 which contribute to 26.44% of its holding. Banks, Consumer Goods and Computers are the top contributors to the fund’s returns. The one-year return of the fund is -19.67% as against -18.61% of the benchmark index. During the one-year period, the fund’s exposure to the scrips such as Axis Bank Ltd.(-3.72%), ICICI Bank Ltd. (4.20%), Strides Pharma Science Ltd. (0.54%), Voltas Ltd. (2.57%), dipped by 69%, 50%, 35% and 36% respectively, which contributed to the downfall in one-year return. It may also be mentioned that the fund’s exposure in the sectors such as Banks (24.47%), Diversified (11.03%) dipped by 44%, 8% which added to the fall to the fund’s performance.
Table 1 above tabulates the allocation of top 10 sectors by the fund. The fund has an allocation to 13 sectors, wherein the top 5 sectors constitutes to 67.90%. The fund could outperform its benchmark index in only 6 out of 12 months during the last one year period, maintaining an average equity exposure of 98.40%.
The risk parameter graph measures standard deviation (S.D.) across all the Large & Midcap schemes. The S.D. of the scheme is 13.96%, which is higher than the industry average of the Large & Midcap schemes of 12.28%. The Sharpe ratio of the scheme is -0.38%, which is higher than the industry average of -0.51%.
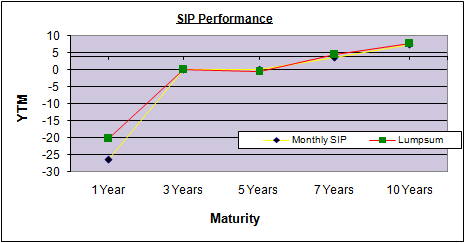
Monthly SIP and Lumpsum vis-à-vis Benchmark: Exhibit 2
| Monthly SIPs Min (Rs.1000 p.m.) | |||||
| SIP Period | Amt Invst. (Rs.) | Aditya Birla Sun Life Equity Advantage Fund (Rs.) | Nifty 50 TRI (Rs.) | ||
| Market Value | Rets (%) | Market Value | Rets (%) | ||
| 1-Yr. | 12,000 | 10,210 | -26.45% | 10,395 | -23.84% |
| 3-Yr. | 36,000 | 29,662 | 0.00% | 30,980 | 0.00% |
| 5-Yr. | 60,000 | 55,140 | 0.00% | 59,327 | -0.44% |
| 7-Yr. | 84,000 | 95,157 | 3.51% | 99,573 | 4.79% |
| 10-Yr. | 1,20,00 | 175,173 | 7.53% | 178,958 | 7.75% |
| Lumpsum (Matching Monthly SIP) | |||||
| SIP Period | Amt Invst. (Rs.) | Aditya Birla Sun Life Equity Advantage Fund (Rs.) | Nifty 50 TRI (Rs.) | ||
| Market Value | Rets (%) | Market Value | Rets (%) | ||
| 1-Yr. | 12,000 | 9,586 | -20.16% | 9,704 | -19.18% |
| 3-Yr. | 36,000 | 29,335 | -9.91% | 31,222 | -6.96% |
| 5-Yr. | 60,000 | 55,883 | -2.36% | 60,664 | 0.37% |
| 7-Yr. | 84,000 | 10,0294 | 4.43% | 10,3734 | 5.28% |
| 10-Yr. | 1,20,000 | 18,3689 | 7.61% | 18,6678 | 7.90% |

Note: (1) Performance is as on May 29, 2020. (2) Returns are calculated on the basis of annual compounding.
As it may be observed in Exhibit 2, the fund has outperformed in returns vis-à-vis its benchmark across all time frames. The returns of the fund in both modes (ie. Monthly and Lumpsum) across various time periods witnessed with mixed noticeable variations.

PERFORMANCE
In Exhibit 4, the fund has showed its monthly performance returns. Its strength is its ability to contain downside during periods of market volatility. The fund has continued with its policy of taking focused exposures in the top companies and sectors. The fund takes a large and micap approach of investing in stocks and, though heavy on large-cap stocks, invests substantially in mid- and small-cap stocks as well. Considering last one year portfolio, the fund has kept almost an average of 57.24% equity assets on large cap side and 36.42% equity assets on midcap stocks. The fund’s notable feature is that the fund has been able to perform in bear market despite of having lower cash levels in its portfolio. The fund’s flexibility to switch between large and mid-cap stocks without any sector bias has helped it to deliver better returns.
Please Note: The ratings mentioned in the report are declared by Value Research and Crisil has ranked 4 for this fund (For the quarter ended March 30, 2020).
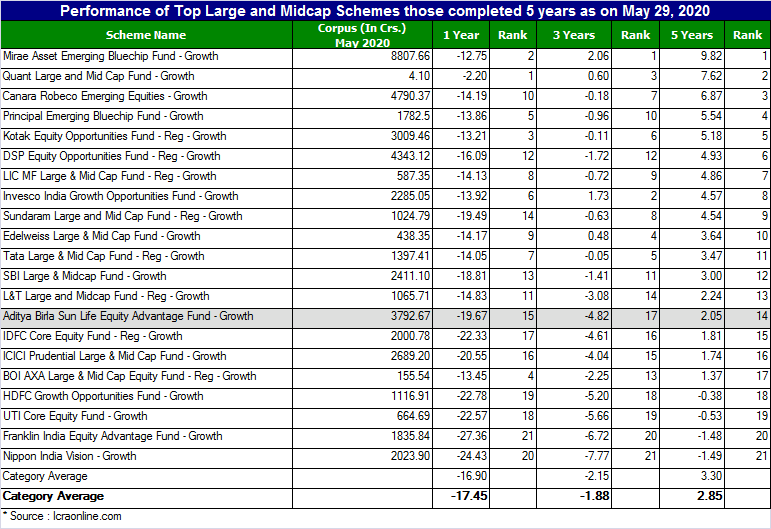
PEER COMPARISON

Start your Investment journey with us
Disclaimer - Mutual Fund investments are subject to market risks, read all scheme related documents carefully.