HDFC Balanced Advtange Fund
Date Published: March 7, 2024

FUND FACTS
|
Nature |
Open ended |
Fund Manager |
Gopal Agrawal, Srinivasan Ramamurthy, Arun Agarwal, Nirman Morakhia, Anil Bamboli |
|
Date of Allotment/ Inception Date |
February 01, 1994 |
Benchmark Index |
NIFTY 50 Hybrid Composite debt 50:50 Index |
|
NAV (Rs.) |
401.06 ( 30-Nov-2023 ) |
Corpus (Rs.in Crs.) |
68386.72 ( Nov-2023 ) |
|
Investment Objective |
To provide long term capital appreciation / income from a dynamic mix of equity and debt investments. There is no assurance that the investment objective of the Scheme will be realized. |
||
PORTFOLIO COMPOSITION
As of 30 Nov 2023, the fund has 58.87% of its net assets invested into equity & equity related instruments, 26.73% in debt and balance 14.40% in cash and others. The large cap holdings constitute of 47.48% (market cap > Rs.49,687 crs), 10.73% in midcap (market cap > Rs.17,409 and < Rs.49,687 crs), 8.72% in small cap (market cap 0 > Rs.17,409 crs), and balance 33.08% in debt and cash component. The top 10 holdings of the scheme constitute 33.06% of its net assets. It may be observed that the Quarterly Average AUM of the fund for the end of December 2023 is Rs.26081.22 crs.
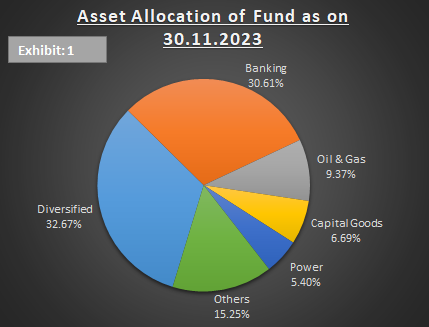
| Sectoral Allocation (in %) as on 30.11.2023 | |
|---|---|
| Top 10 holdings of Fund (Table 1) | Fund Allocation |
| Diversified | 32.67 |
| Banking | 30.61 |
| Oil & Gas | 9.37 |
| Capital Goods | 6.69 |
| Power | 5.40 |
| Housing | 5.22 |
| IT | 3.40 |
| FMCG | 2.65 |
| Telecom | 1.72 |
| Auto | 1.67 |
| Month End | Equity % | Debt % | Cash % | Scheme % Returns | Category Average% Returns |
|---|---|---|---|---|---|
| 30.11.2023 | 58.87 | 26.73 | 14.40 | 6.04 | 4.19 |
| 31.10.2023 | 58.91 | 26.31 | 14.79 | -1.48 | -1.40 |
| 29.09.2023 | 59.73 | 25.56 | 14.71 | 3.43 | 1.56 |
| 31.08.2023 | 58.97 | 25.96 | 15.06 | 0.71 | 0.03 |
| 31.07.2023 | 60.71 | 24.29 | 15.00 | 4.58 | 2.53 |
| 30.06.2023 | 60.58 | 24.91 | 14.51 | 3.30 | 2.80 |
| 31.05.2023 | 59.72 | 24.69 | 15.59 | 1.57 | 2.15 |
| 28.04.2023 | 59.75 | 24.38 | 15.86 | 5.20 | 3.93 |
| 31.03.2023 | 59.03 | 25.61 | 15.36 | 1.12 | 0.24 |
| 28.02.2023 | 59.47 | 25.27 | 15.26 | -0.34 | -0.29 |
| 31.01.2023 | 60.78 | 24.48 | 14.74 | -0.67 | -1.07 |
| 30.12.2022 | 63.23 | 23.39 | 13.37 | -0.97 | -1.52 |
| Top 10 Holdings (% in N.A) | Nov-23 | May-23 | Dec-22 |
|---|---|---|---|
| HDFC Bank Ltd. | 6.20 | 4.24 | 5.11 |
| Coal India Ltd. | 4.16 | 4.26 | 4.34 |
| National Thermal Power Corporation Ltd. | 3.49 | 3.23 | 3.39 |
| ICICI Bank Ltd. | 3.49 | 4.52 | 4.60 |
| State Bank Of India | 3.35 | 4.40 | 5.13 |
| ITC Ltd. | 2.69 | 3.68 | 3.03 |
| Infosys Ltd. | 2.53 | 2.71 | 3.15 |
| Larsen & Toubro Ltd. | 2.53 | 2.32 | 2.41 |
| Power Finance Corporation Ltd. | 2.42 | 2.21 | 2.08 |
| Reliance Industries Ltd. | 2.20 | 2.68 | 2.60 |
PORTFOLIO ANALYSIS
Balanced advantage funds (BAF) or dynamic asset allocation funds (DAAF) are hybrid funds — they invest in a mix of equity and debt instruments. Unlike traditional hybrid funds, which hold equity and debt allocations within specific and defined limits, balanced funds have no such constraints and modify their allocations more flexibly. These are also termed as Dynamic Asset Allocation Funds, particularly because these funds can adapt to the dynamic capital market, easily. In equity segment, the fund invests in companies of all sizes, with a focus on those experiencing strong revenue growth due to business expansion. In debt segment, the fund usually in high-quality bonds to manage risk effectively. The fund's top 5 holdings are in State Bank of India, HDFC Bank, ICICI Bank, Coal India Ltd., National Thermal Power Corp. Ltd as on 30th Nov 2023.
Table 1 above tabulates the allocation of top 10 sectors by the fund. The fund has an allocation to 14 sectors, wherein the top 5 sectors constitutes to 84.75%. The fund could outperform its benchmark index in 09 out of 12 months during the last one year period, maintaining an average equity exposure of 59.98%.
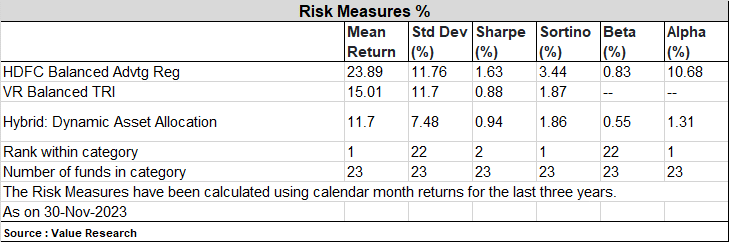
The risk parameter graph measures standard deviation (S.D.) across all the Hybrid: Dynamic Asset Allocation schemes. The S.D. of the scheme is 11.76%, which is higher than the industry average of the Dynamic Asset Allocation schemes of 7.48%. The Sharpe ratio of the scheme is 1.63%, which is higher than the industry average 0.94%.
Monthly SIP and Lumpsum vis-à-vis Benchmark:
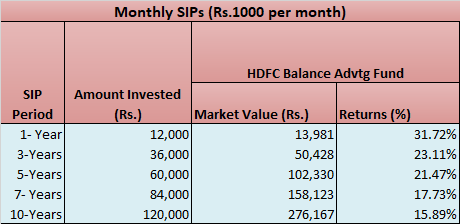
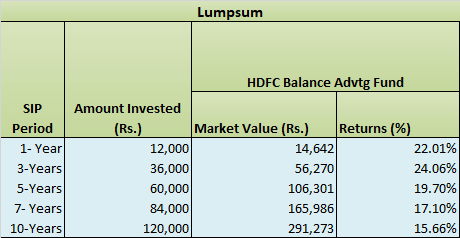
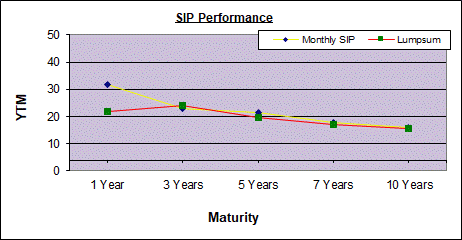
Note: (1) Performance is on November 30, 2023. (2) Returns are calculated on the basis of annual compounding. As it may be observed in Exhibit 2, the returns of the fund in both modes (ie. Monthly and Lumpsum) across various time periods witnessed with mixed noticeable variations.
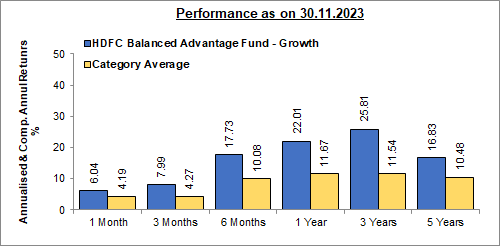
PERFORMANCE: In Exhibit 4, the scheme has outperformed the benchmark index in all time horizons. The fund has also outperformed its category average over all time period respectively. These returns highlight the fund’s strong performance over different time periods, making it an attractive choice for investors seeking good returns for their investments. This Fund Holds Rs.68,386.72 crores of Corpus, the highest AUM in the balanced advantage fund category. The fund has delivered a strong sound track record, delivering consistent returns while effectively managing risk – making it an attractive choice for stability and growth seekers.
Please Note:The ratings mentioned in the report are declared by Value Research
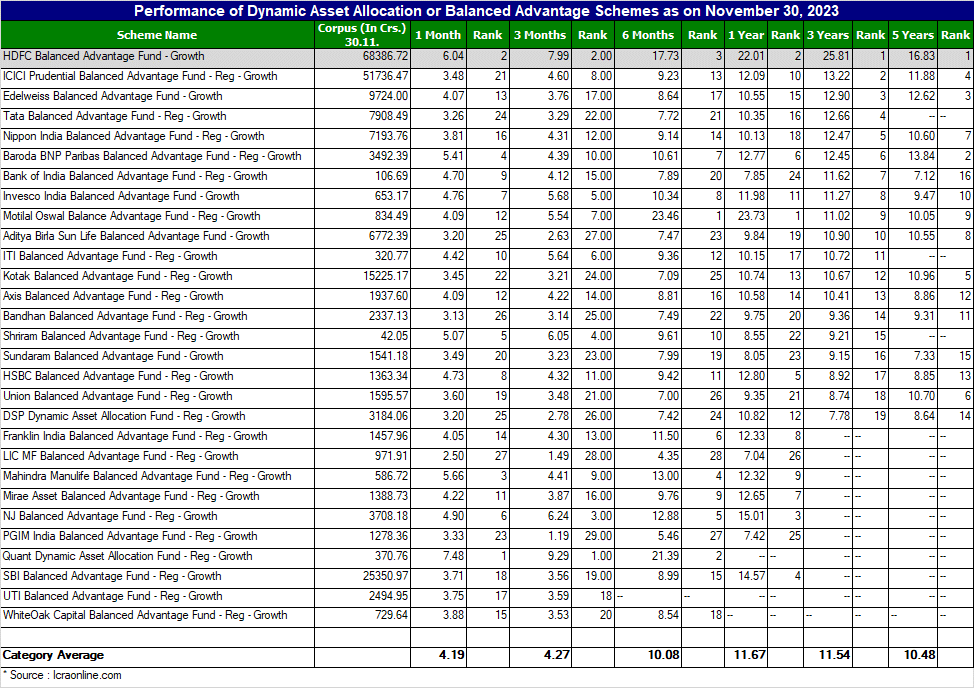
PEER COMPARISON
Start your Investment journey with us
Disclaimer - Mutual Fund investments are subject to market risks, read all scheme related documents carefully.